Here is another big box in my brain! – A data enthusiast from a social science background, currently diving deep into data analytics. I’m all about using data to make a real difference and drive social impact. Armed with statistical wizardry up my sleeves and data visualization skills, I’m on a mission to bridge the gap between data analytics and solving society’s challenges. Let’s make some data magic happen.
Collect

Coming from a background in social research and impact, I have theoretical and practical knowledge of questionnaire design, impact assessment and monitoring and evaluation. I have data collection and management experience with Kobo Toolbox, Qualtrics, Commcare and Airtable.
Process

A data analyst and scientist with a background in data tools like SPSS and STATA. Currently building a portfolio in other languages and softwares such as SQL, Python and R. I can offer support on improving existing workflows, covering data transformation, unification, spatial, descriptive and predictive analysis, and more.
Visualise

I am a Tableau Desktop Certified Professional with extensive knowledge of data visualisation best practices. I have experience creating interactive tools and static infographics that can be consumed online or in print. Besides Tableau I have worked with Power BI as well.
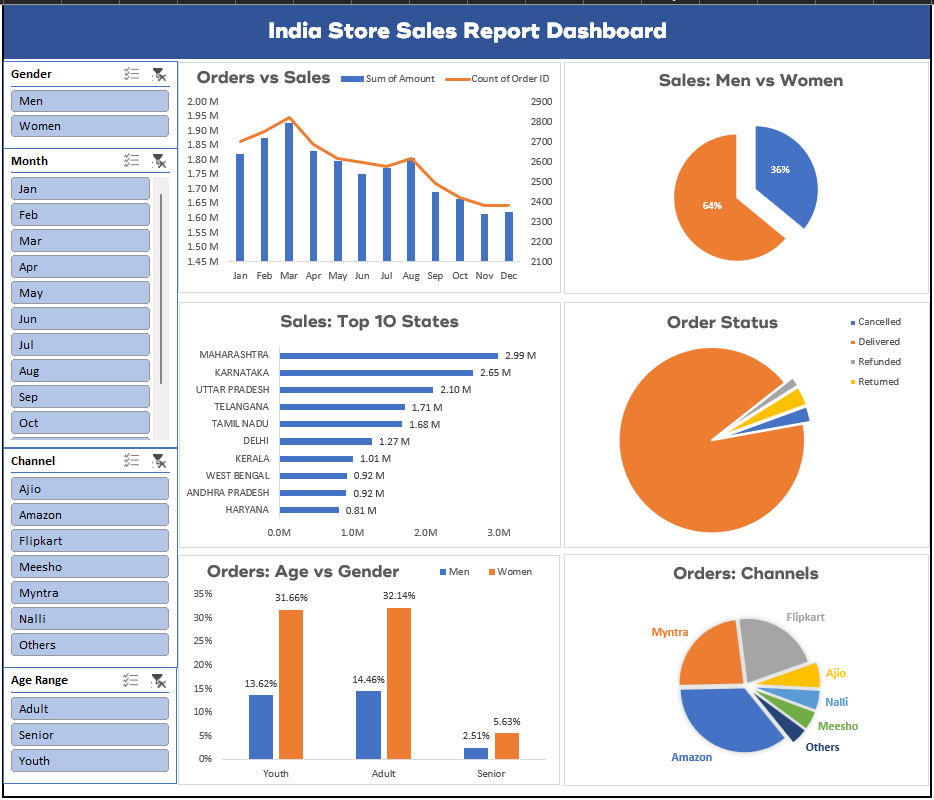
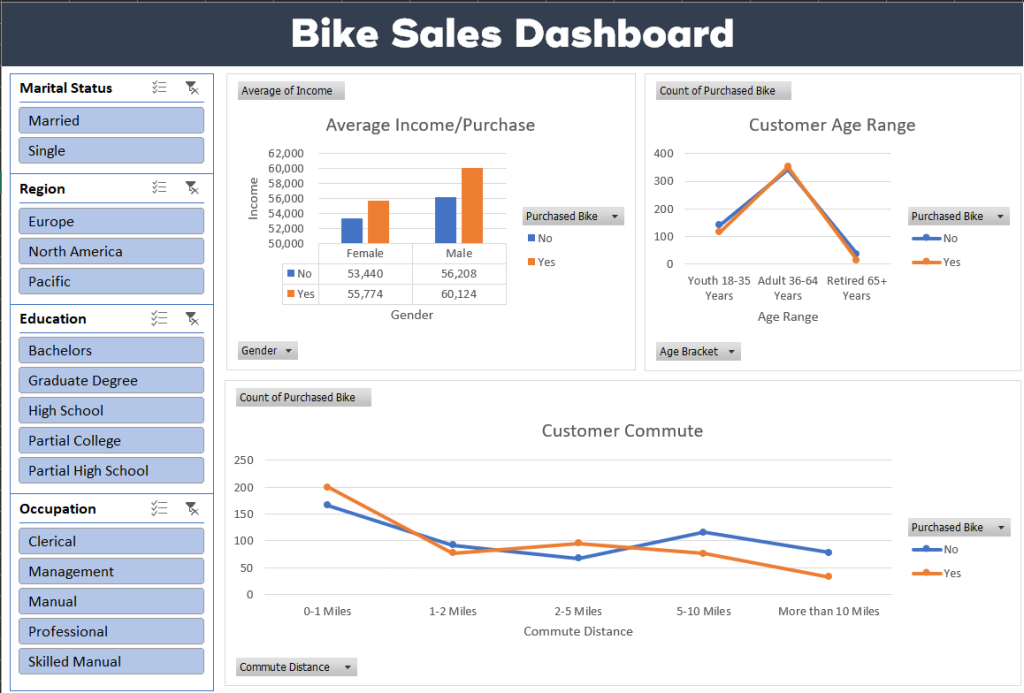
Data Analysis in Microsoft Excel
The following projects were created as mockup projects in Microsoft Excel to showcase data analysis and visualisation skills in my portfolio. The entire projects were developed using Microsoft Excel, and it involved a series of essential data processes, including data cleaning, data processing, data analysis, and data visualisation to produce insightful reports and dashboards.

Data Analysis in SQL
Data Visualisation in Tableau
Data Visualisation in Power BI
Philippians 1:6
being confident of this very thing, that He who has begun a good work in you will complete it until the day of Jesus Christ
